Climate / Air
Three environmental indicators are observed for the development of the environmental good climate / air. They describe the energy consumption with total primary energy consumption and final energy consumption of households, carbon dioxide emissions, especially the carbon dioxide emitted due to energy consumption and the emissions of the end-user transport sector, and the energy productivity. The data are collected by the Länderkreis Energiebilanzen (states' working group energy balances).
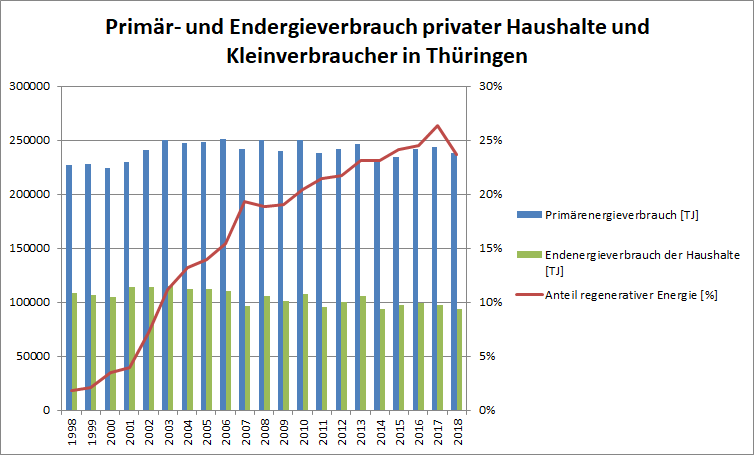
Primary and final energy consumption of private households and small consumers in Thuringia
Definition:
Primary energy consumption is the total energy supplied to an economy per year. It is, therefore, a suitable indicator of the consumption of resources and the cause of greenhouse gas emissions. In addition, the share of renewable energies in primary energy consumption is recorded. Among other sources, renewable energy is generated from biomass plants, wind power, hydropower, sewage and landfill gas as well as solar plants.
Final energy consumption provides information on the energy consumption of private households and small consumers (households, industry, trade, services and other consumers).
Condition of the environment and development:
Primary energy consumption has risen slightly in recent years and has recently levelled out at around 240,000 TJ. Due to the increasing energy demand (including electrical devices, decreasing population numbers, an increasing number of households), a further increase is likely.
This is counteracted by the continuous increase in the share of renewable energies and the associated reduction in energy-related CO2 emissions. In 2012, almost 18 per cent of primary energy consumption was generated by biomass plants.
Chart and table:
| Jahr | Primary energy consumption [TJ] | Share of renewable energy [TJ] | Share of renewable energy [%] | Final energy consumption of households [TJ] |
|---|---|---|---|---|
| 1998 | 227214 | 4158 | 1,83 | 108005 |
| 1999 | 227872 | 4657 | 2,04 | 106382 |
| 2000 | 224078 | 7784 | 3,47 | 104315 |
| 2001 | 229824 | 9069 | 3,95 | 113505 |
| 2002 | 240784 | 17195 | 7,14 | 113784 |
| 2003 | 249587 | 27858 | 11,16 | 114763 |
| 2004 | 247177 | 32701 | 13,23 | 111769 |
| 2005 | 248551 | 34687 | 13,96 | 111723 |
| 2006 | 250626 | 38721 | 15,45 | 110547 |
| 2007 | 241970 | 46682 | 19,29 | 96304 |
| 2008 | 249606 | 47148 | 18,89 | 105894 |
| 2009 | 239922 | 45711 | 19,05 | 100778 |
| 2010 | 249701 | 51019 | 20,43 | 107366 |
| 2011 | 237603 | 51008 | 21,47 | 94987 |
| 2012 | 241498 | 52351 | 21,68 | 99955 |
| 2013 | 246312 | 56856 | 23,08 | 105194 |
| 2014 | 231929 | 53614 | 23,12 | 93277 |
| 2015 | 233918 | 56327 | 24,08 | 97114 |
| 2016 | 241668 | 59270 | 24,53 | 98845 |
| 2017 | 243714 | 64216 | 26,35 | 97645 |
Source: Länderarbeitskreis Energiebilanzen, Table Primary energy consumption by energy source, final energy consumption by consumer groups (as of March 5, 2019)
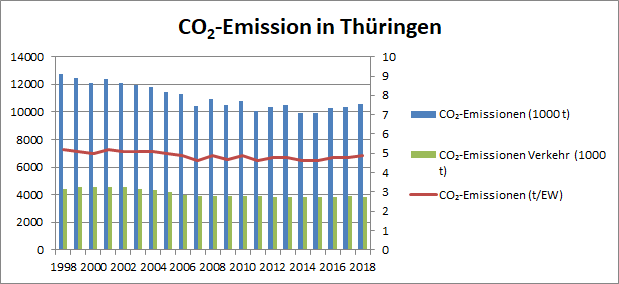
Carbon dioxide emissions
Definition:
This indicator is used to record and present carbon dioxide, actually emitted as a result of energy consumption. Merely emissions from the fossil energy sources coal, gas, mineral oil, and carbon-containing products are included. The CO2 emissions from the transport end-use sector are derived from the road, rail, air and inland waterway transport sectors.
Condition of the environment and development:
Over the last ten years, energy-related carbon dioxide emissions have decreased by about 1.5 million tonnes. This positive development is mainly due to the increasing share of renewable energies, which can partly replace fossil energies. However, the trend is slowing down noticeably.
CO2 emissions from transport initially developed in the opposite direction. Until 2001 it increased slowly but steadily. Since 2002, the numerous measures to reduce CO2 emissions have been showing an effect and figures have been falling again. However, forecast increases in traffic volumes and thus in climate-relevant CO2 emissions can only be partially offset by technical saving opportunities.
Chart and table:
| Jahr | CO₂ emissions (1000 t) | CO₂ emissions (t/inhabitant) | CO₂ emissions transport (1000 t) |
|---|---|---|---|
| 1998 | 12740 | 5,2 | 4394 |
| 1999 | 12470 | 5,1 | 4551 |
| 2000 | 12081 | 5,0 | 4530 |
| 2001 | 12368 | 5,2 | 4566 |
| 2002 | 12095 | 5,1 | 4552 |
| 2003 | 11942 | 5,1 | 4425 |
| 2004 | 11816 | 5,1 | 4319 |
| 2005 | 11470 | 5,0 | 4159 |
| 2006 | 11288 | 4,9 | 3969 |
| 2007 | 10437 | 4,6 | 3929 |
| 2008 | 10917 | 4,9 | 3929 |
| 2009 | 10527 | 4,7 | 3890 |
| 2010 | 10772 | 4,9 | 3932 |
| 2011 | 10099 | 4,6 | 3902 |
| 2012 | 10369 | 4,8 | 3840 |
| 2013 | 10501 | 4,8 | 3840 |
| 2014 | 9885 | 4,6 | 3837 |
| 2015 | 9929 | 4,6 | 9796 |
| 2016 | 10286 | 4,8 | 3843 |
| 2017 | 10385 | 4,8 | 3867 |
Source: Länderarbeitskreis Energiebilanzen; Table CO2 emissions by energy source, CO2 intensity, CO2 emissions per inhabitant, CO2 emissions by emitter sector (polluter balance) (as of March 5, 2019)
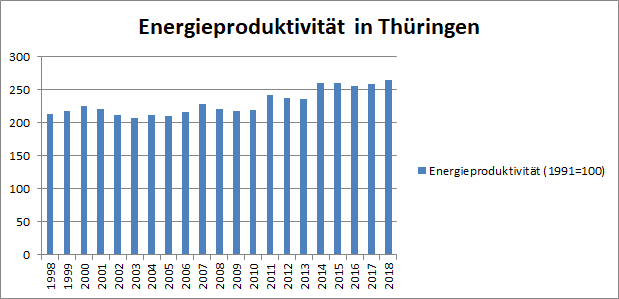
Energy productivity
Definition:
Energy productivity is calculated as the quotient of gross domestic product and primary energy consumption (total of all energy sources available to meet domestic energy demand). The more economic output (GDP) can be "produced" from a unit of primary energy used, the more efficiently the national economy uses the resource energy.
Condition of the environment and development:
Energy productivity has more than doubled between 1991 and 1997 and has been 2.5 times higher since 2014. Thus, the aim of the national sustainability strategy to double energy productivity between 1990 and 2020 has been achieved ahead of schedule.
Chart and table:
| Jahr | Energy productivity (1991=100) |
|---|---|
| 1998 | 212,9 |
| 1999 | 217,7 |
| 2000 | 225,3 |
| 2001 | 221,3 |
| 2002 | 211,5 |
| 2003 | 206,9 |
| 2004 | 212,3 |
| 2005 | 210,3 |
| 2006 | 216,1 |
| 2007 | 228,9 |
| 2008 | 221,2 |
| 2009 | 218,0 |
| 2010 | 220,0 |
| 2011 | 241,8 |
| 2012 | 237,8 |
| 2013 | 236,1 |
| 2014 | 259,8 |
| 2015 | 260,7 |
| 2016 | 256,1 |
| 2017 | 258,7 |
Source: Länderarbeitskreis Energiebilanzen Table Energy productivity, energy intensity, energy consumption per inhabitant