Water
The development of the environmental good water is documented by three environmental indicators. These are the population's connection rate to public sewerage systems and sewage treatment plants, the type of public sewage treatment plants, and the water quality of surface waters. The data are collected by TLS and TLUG.
Wastewater and sewage treatment plants
Definition:
These indicators provide information regarding the implementation of the goal: the reduction of groundwater and surface water pollution due to inadequate treatment of wastewater. The percentage of the population that is connected to the municipal sewerage system or a municipal sewage treatment plant is recorded. Moreover, a distinction is made between purely mechanical, mechanic-biological, and more extensive purification (e.g. with denitrification and phosphorus elimination).
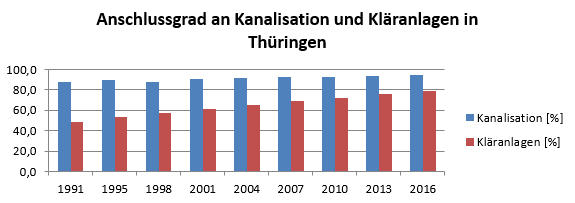
Development of the connection rate:
There is still a demand for action in terms of connecting the population to municipal sewage treatment plants as Thuringia is well below the national average.
Chart and table:
| Jahr | sewage system [%] | sewage treatment plants [%] |
|---|---|---|
| 1991 | 87,6 | 49,0 |
| 1995 | 89,4 | 53,5 |
| 1998 | 88,0 | 57,6 |
| 2001 | 90,6 | 61,1 |
| 2004 | 91,5 | 64,9 |
| 2007 | 92,1 | 68,7 |
| 2010 | 92,3 | 72,2 |
| 2013 | 93,5 | 75,8 |
| 2016 | 94,9 | 78,8 |
Source: Thuringian State Office for Statistics: Table Public wastewater treatment - inhabitants connected to the public sewerage system by districts in Thuringia
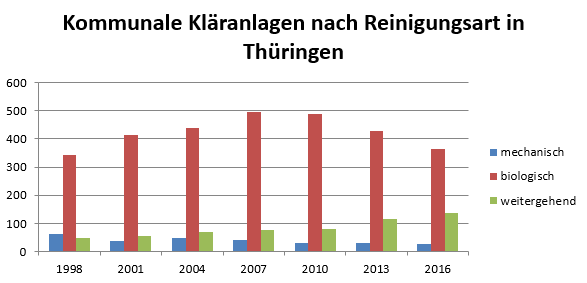
Development of the types of sewage treatment plants:
The sewage treatment plants with merely mechanical purification are gradually dismantled. Instead, the percentage of biological systems is increasing enormously, especially in rural areas. More than 200 new plants were built in 2002. However, when looking at the purification capacity, sewage treatment plants with more extensive purification form the largest group, as these are mostly used in urban settlements. Here the number has more than doubled over the last ten years.
Chart and table:
| Jahr | mechanical | biological | more extensive | gesamt |
|---|---|---|---|---|
| 1998 | 63 | 341 | 49 | 453 |
| 2001 | 37 | 413 | 57 | 507 |
| 2004 | 48 | 438 | 69 | 555 |
| 2007 | 42 | 496 | 77 | 615 |
| 2010 | 31 | 488 | 80 | 599 |
| 2013 | 30 | 426 | 117 | 573 |
| 2016 | 28 | 364 | 137 | 529 |
Source: Thuringian State Office for Statistics: Table Public wastewater treatment - wastewater treatment plants, connected inhabitants and annual wastewater volume by districts in Thuringia
Water quality
Definition:
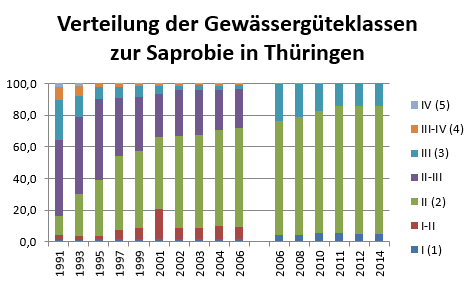
The water quality is assessed on the basis of the insect larvae, mussels, crustaceans, worms, etc. (macrozoobenthos) living on the underwater ground. The composition of this biocoenosis varies greatly, depending on the sensitivity of individual species to changes in the oxygen balance resulting from the degradation of organic pollutants. The settlement pattern thus provides information on the extent of damage caused by sewage discharges. Until 2006, the water quality was evaluated using this saprobic system (DIN 38 410). For this purpose, a 7-level representation of the pollution levels was common, from "unpolluted" to "excessively polluted". The remediation objective was quality class II, which corresponded to only moderate wastewater pollution. With the EU Water Framework Directive (WFD), the saprobic system found its way into the European assessment principles in a modified version:
The adjustments concern the consideration of regional differences in the flowing water systems (water body type-related assessment), the extended range of significant animal species, and the implementation of a 5-level assessment scale with new class boundaries. Even though the WDF requires an overall ecological assessment of water bodies and additional biological components such as aquatic plants (including algae) and fish stocks are to be used for this purpose, the saprobic system remains a recognised water management assessment basis for describing impairments caused by wastewater discharge.
Condition of the environment and development:
The above-described adjustments to the saprobic system in the course of the introduction of the EU WDF make a direct comparison of the data before and after 2006 difficult. Nevertheless, it becomes clear that after the rapid improvements in the 1990s, the positive process is still continuing, albeit at a slower pace altogether. The restoration objective is now to achieve at least a good saprobic water body status (quality class 2).
Chart and table:
| year | I | I-II | II | II-III | III | III-IV | IV |
|---|---|---|---|---|---|---|---|
| 1991 | 1,1 | 2,9 | 12,3 | 48,2 | 24,9 | 8,2 | 2,4 |
| 1993 | 1,0 | 2,8 | 26,6 | 24,4 | 13,3 | 6,0 | 1,9 |
| 1995 | 1,6 | 1,9 | 35,5 | 50,9 | 7,9 | 2,2 | 0,0 |
| 1997 | 1,7 | 5,8 | 46,4 | 36,9 | 7,2 | 1,5 | 0,5 |
| 1999 | 2,0 | 6,5 | 48,7 | 34,1 | 6,9 | 1,7 | 0,1 |
| 2001 | 1,6 | 19,1 | 45,2 | 27,4 | 5,2 | 1,4 | 0,1 |
| 2002 | 1,8 | 7,2 | 57,9 | 29,2 | 2,4 | 1,2 | 0,3 |
| 2003 | 1,6 | 7,0 | 58,8 | 28,2 | 3,1 | 1,2 | 0,1 |
| 2004 | 2,1 | 7,6 | 60,8 | 25,2 | 2,9 | 1,2 | 0,1 |
| 2006 | 1,9 | 7,7 | 62,3 | 24,3 | 2,7 | 1,0 | 0,1 |
| 2006 | 4,4 | 71,6 | 23,8 | 0,2 | |||
| 2008 | 4,6 | 73,9 | 21,3 | 0,2 | |||
| 2010 | 5,5 | 76,9 | 17,4 | 0,2 | |||
| 2011 | 5,5 | 80,1 | 14,3 | 0,0 | |||
| 2012 | 4,9 | 81,0 | 14,1 | 0,0 | |||
| 2014 | 5,0 | 80,9 | 14,1 | 0,0 |
Source: Thuringian State Office for Environment and Geology